# Dashboards
The Platforce CRM dashboards give your users a snapshot of the most important metrics providing a broad overview of sales activities and KPIs. Dashboards also include completed and upcoming events.
To open a dashboard:
Click the
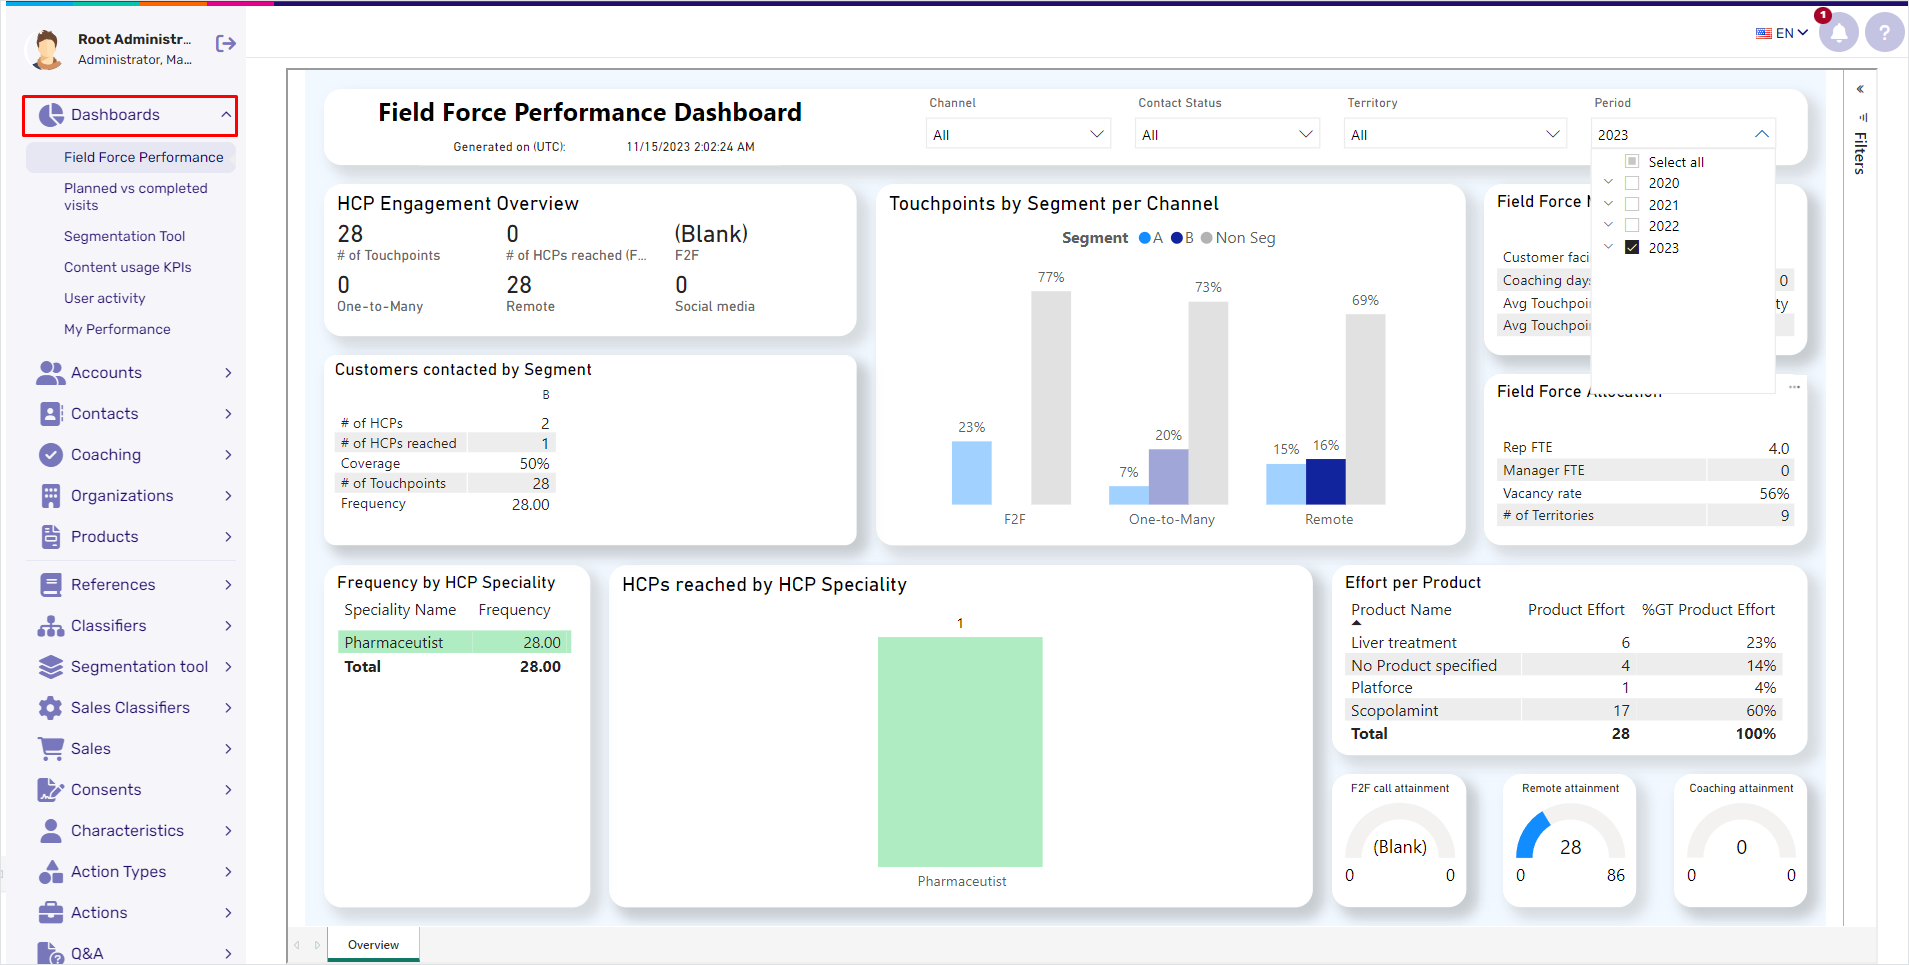
Dashboardssection in the navigation menu.Select the required dashboard from the list.
By default, the first dashboard in the list is displayed on the page.
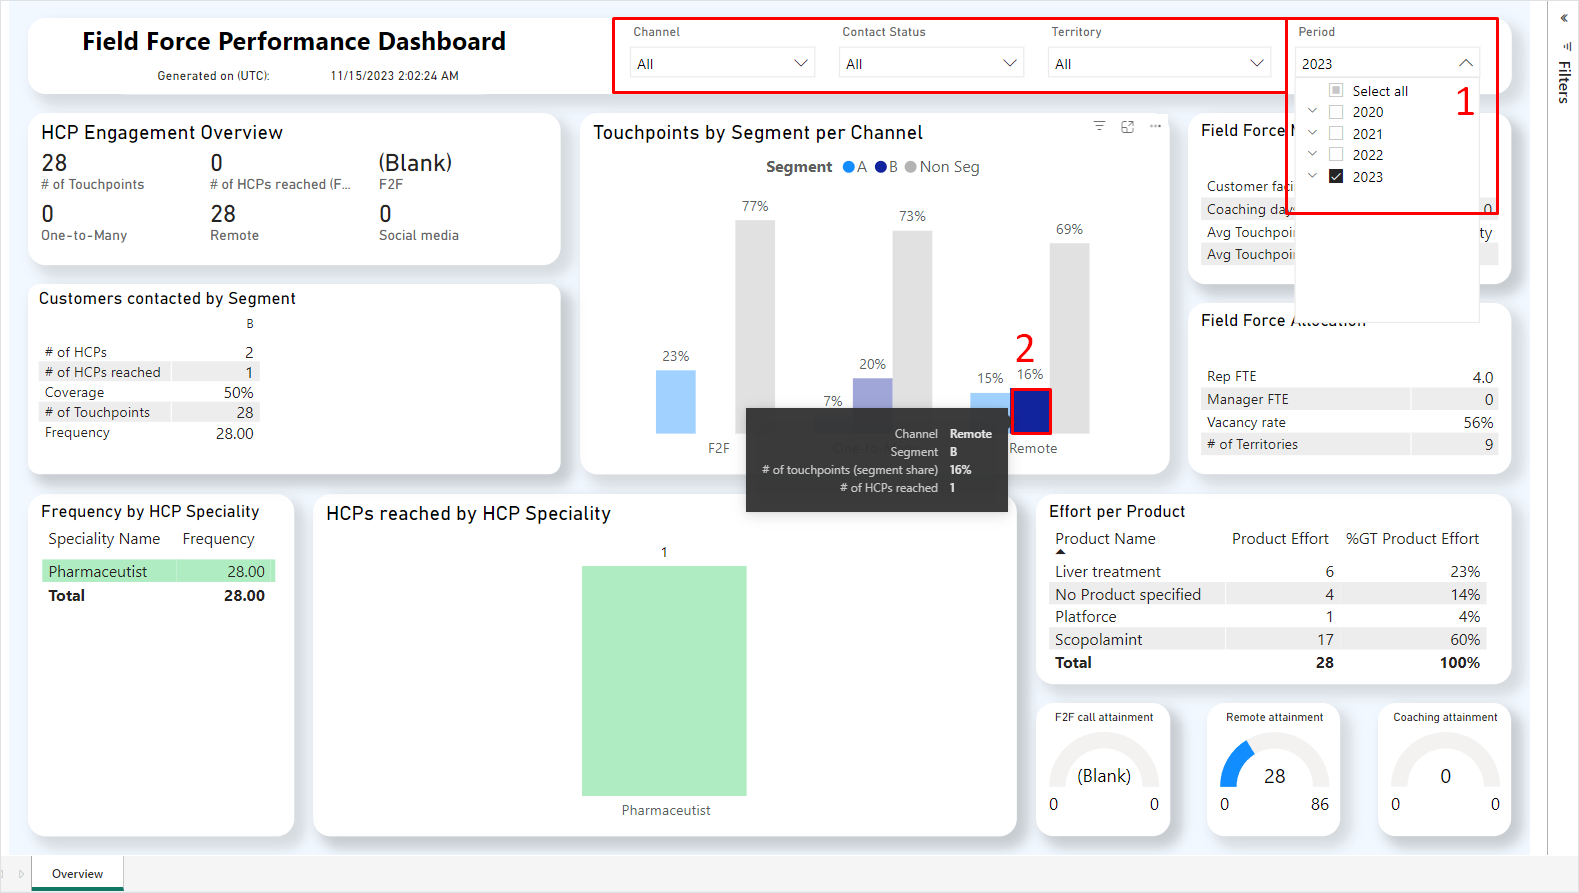
To streamline your search through dashboard data, use filters in the upper-right corner of the page [1] or click the displayed data [2].
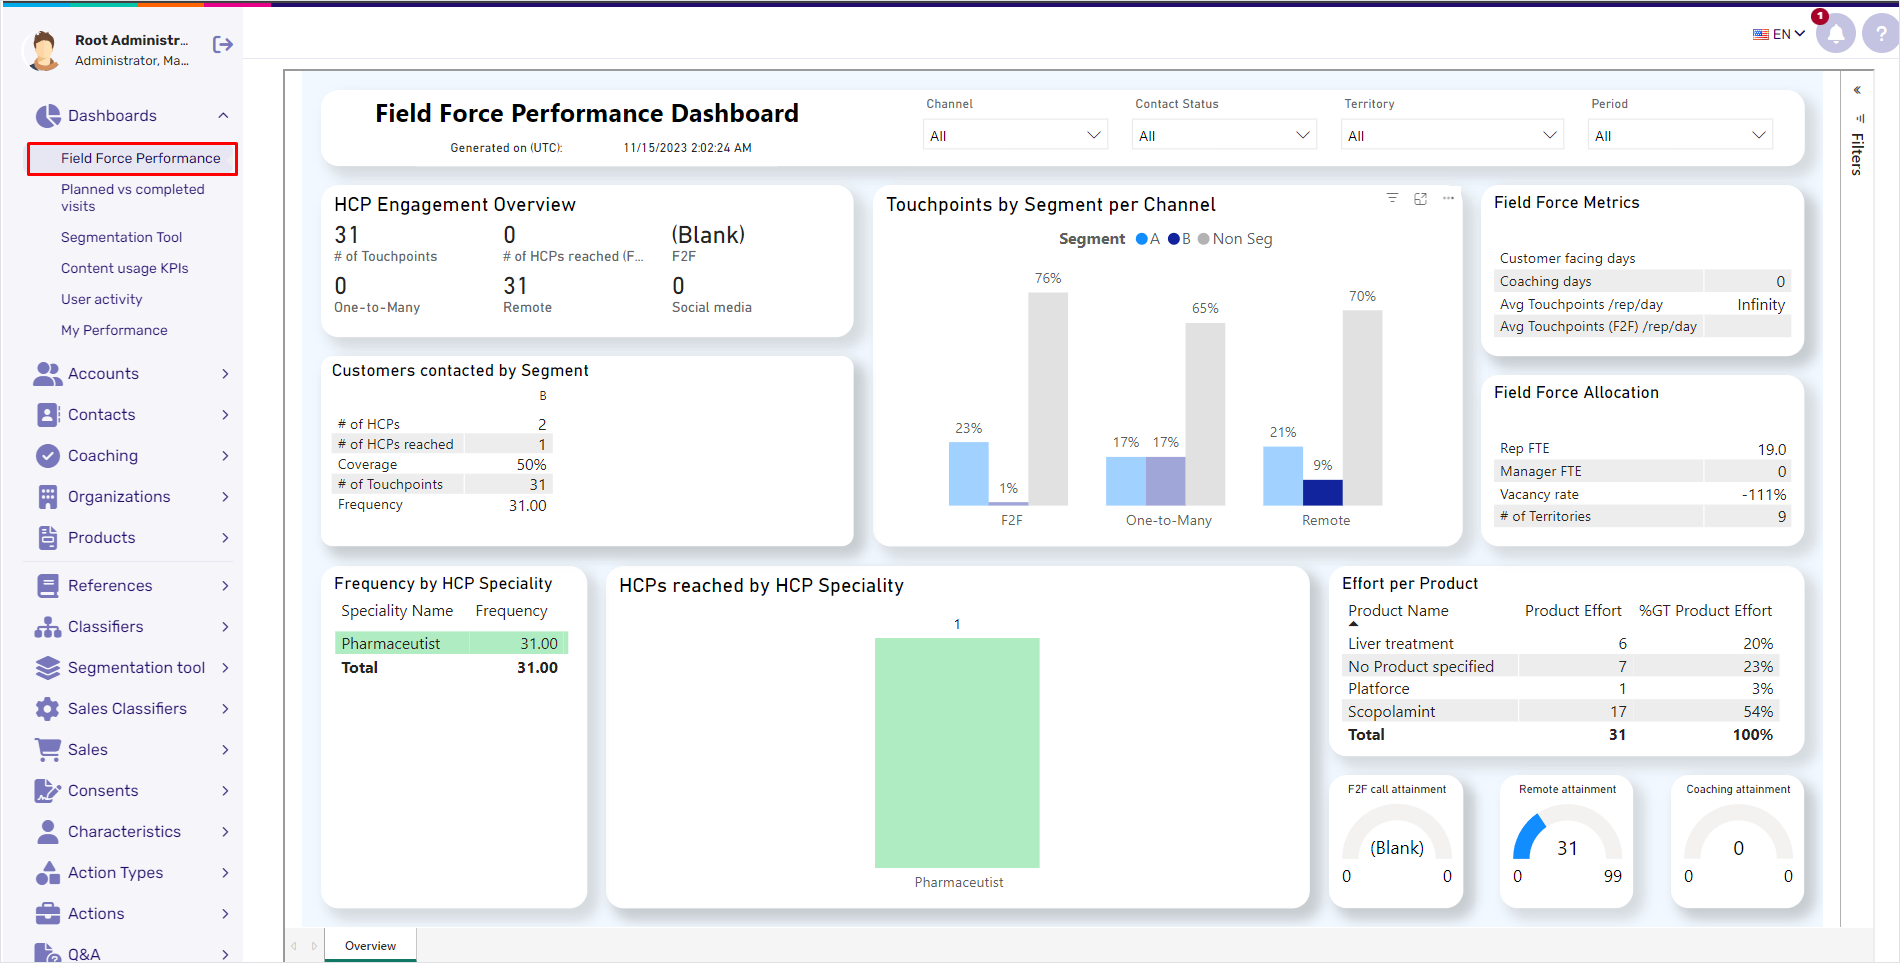
In the Dashboards section, you can find the following dashboards:
- Field force performance
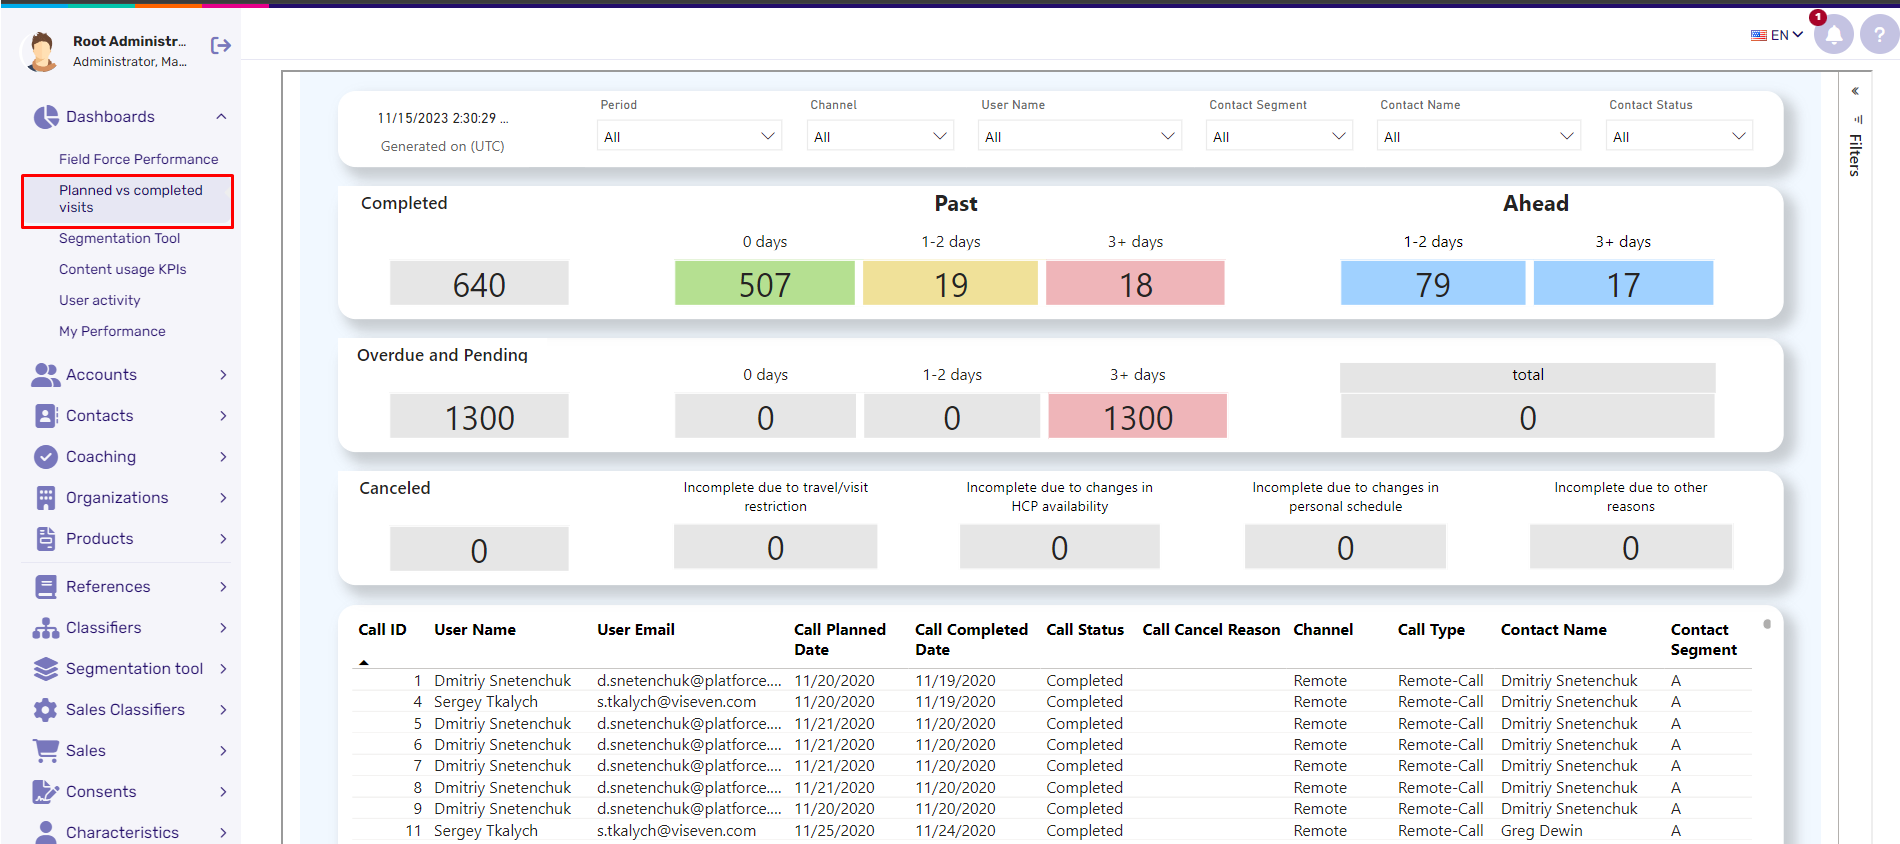
- Planned vs Completed visits
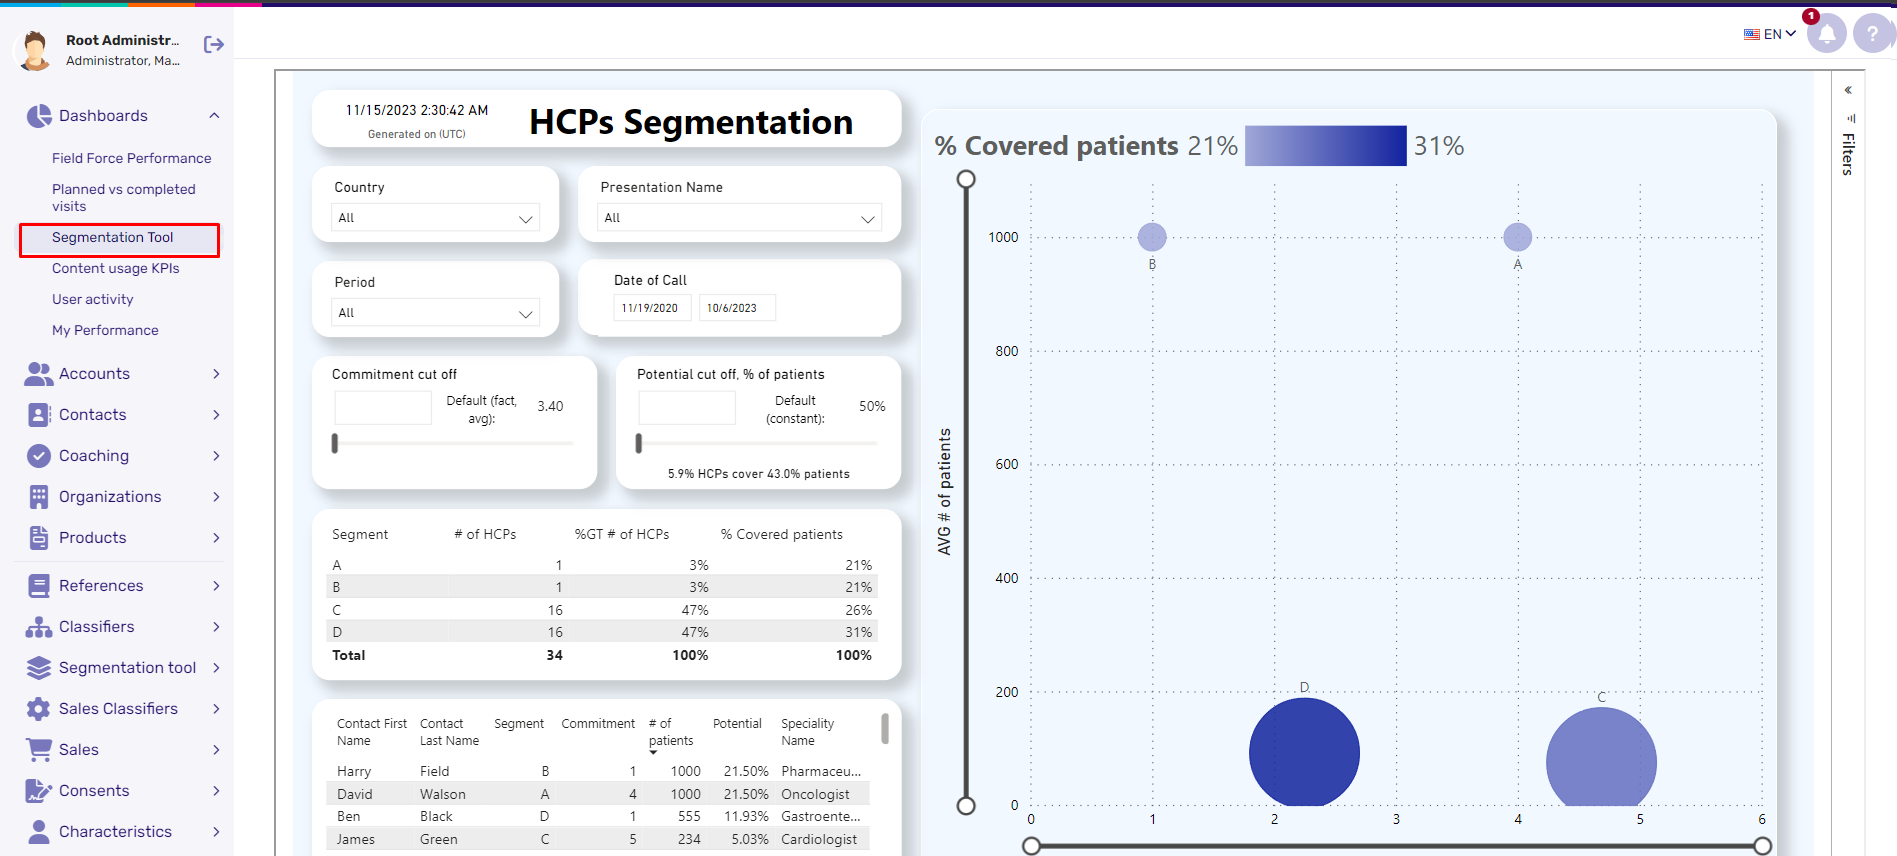
- Segmentation tool
- My performance
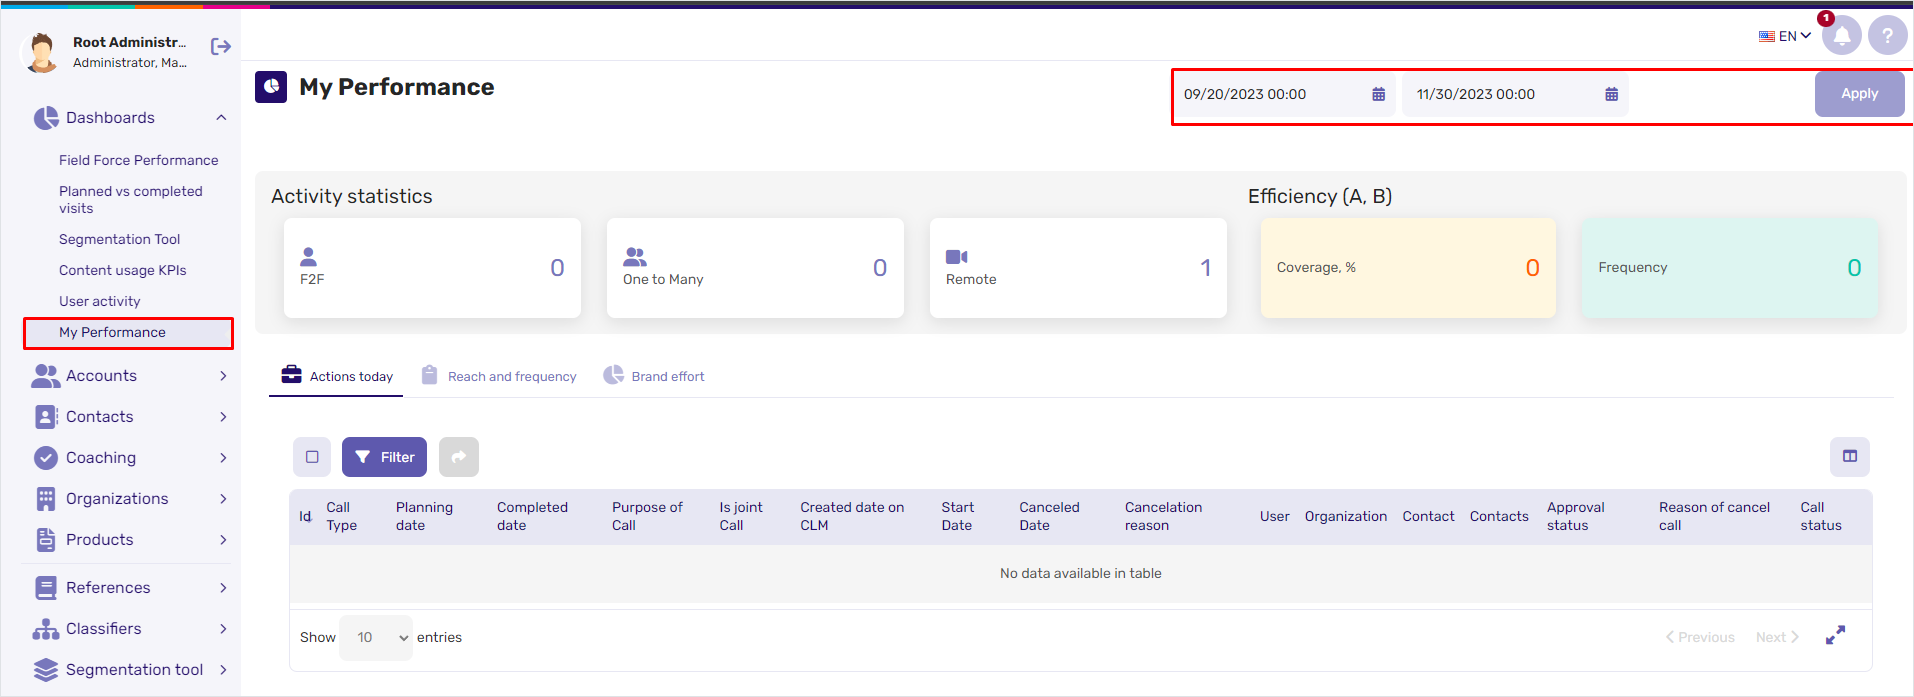
The My performance dashboard contains Activity statistics and Efficiency blocks. You can also view personal performance data in the Reach and frequency, Brand effort, and Actions today tables on the dashboard page. To filter data by a definite time range, set the required start and end dates in the filter at the top of the page.
